Lets work together
We can't find the internet
Something went wrong!
Linear regression for MPG

- Created: 25/09/2016
- Last updated: 13/12/2024
I have been working through my second MOOC, Machine Learning, by Stanford University. It is fascinating, and I would recommend it to anyone who has a bit of maths and programming knowledge.
In order to test out my new skills, I am trying out some of the machine learning techniques taught to make predictions on the auto-mpg dataset.
Specifically I plan to pre-process the dataset in a reproducible manner, and then to implement multivariate linear regression and batch gradient descent to accurately predict MPG for cars :)
Preparing the data
Before I can start on the linear regression, the dataset needs a bit of a tidy up.
I want a quick, repeatable way to pre-process my dataset, this way I can
test my code on many mixes of the data, and theoretically new data can be easily
added later on. A bash script, making good use of stream editors like awk and
sed will do the job nicely.
First off the data comes with inconsistent column spacing, inconsistent use of brand name abbreviations, and also typos in brand names.
Step 1 is make the spacing consistent… this will make life easier for me in a moment.
cat auto_mpg.data | sed -e 's/\(\s\{2,\}\|\t\+\)/\ \ \ \ /g'
I am interested to see if there is a correlation between make of car and mpg. As
each brand makes a type of car for a type of person, I expect each brand to have
a distinct range of MPGs. In order to plot this, I can extract car brands from
the last column using awk and friends:
...

| awk -F'    ' '{print $NF}' | sed -e 's/"//g' | awk -F' ' '{print$1}' \
| sort | uniq
To me, the only unknown brand that came out of this was hi 1200d. Googling this
found nothing useful, so, until I hear out otherwise, ‘hi’ are going to make cars :)
Next I put together brands.sed which maps variations of each brand name to a canonical brand name, and then in brands_ids.sed I give each brand an id and add it as a column on my dataset.
...

| sed -f brands.sed \
| awk -F'    ' 'match($9, /[A-Za-z\-]+/) {print $0 "    \"" substr($9, RSTART, RLENGTH)"\""}' \
| sed -f brands_ids.sed
This could obviously be done in another language and the information could be stored in a database… but I want to practice my bash scripting, and for this exercise, file storage wont cause me any issues.
Visualising data
Running pairwise_comparison.plot through gnuplot makes this 2d comparison of all features:
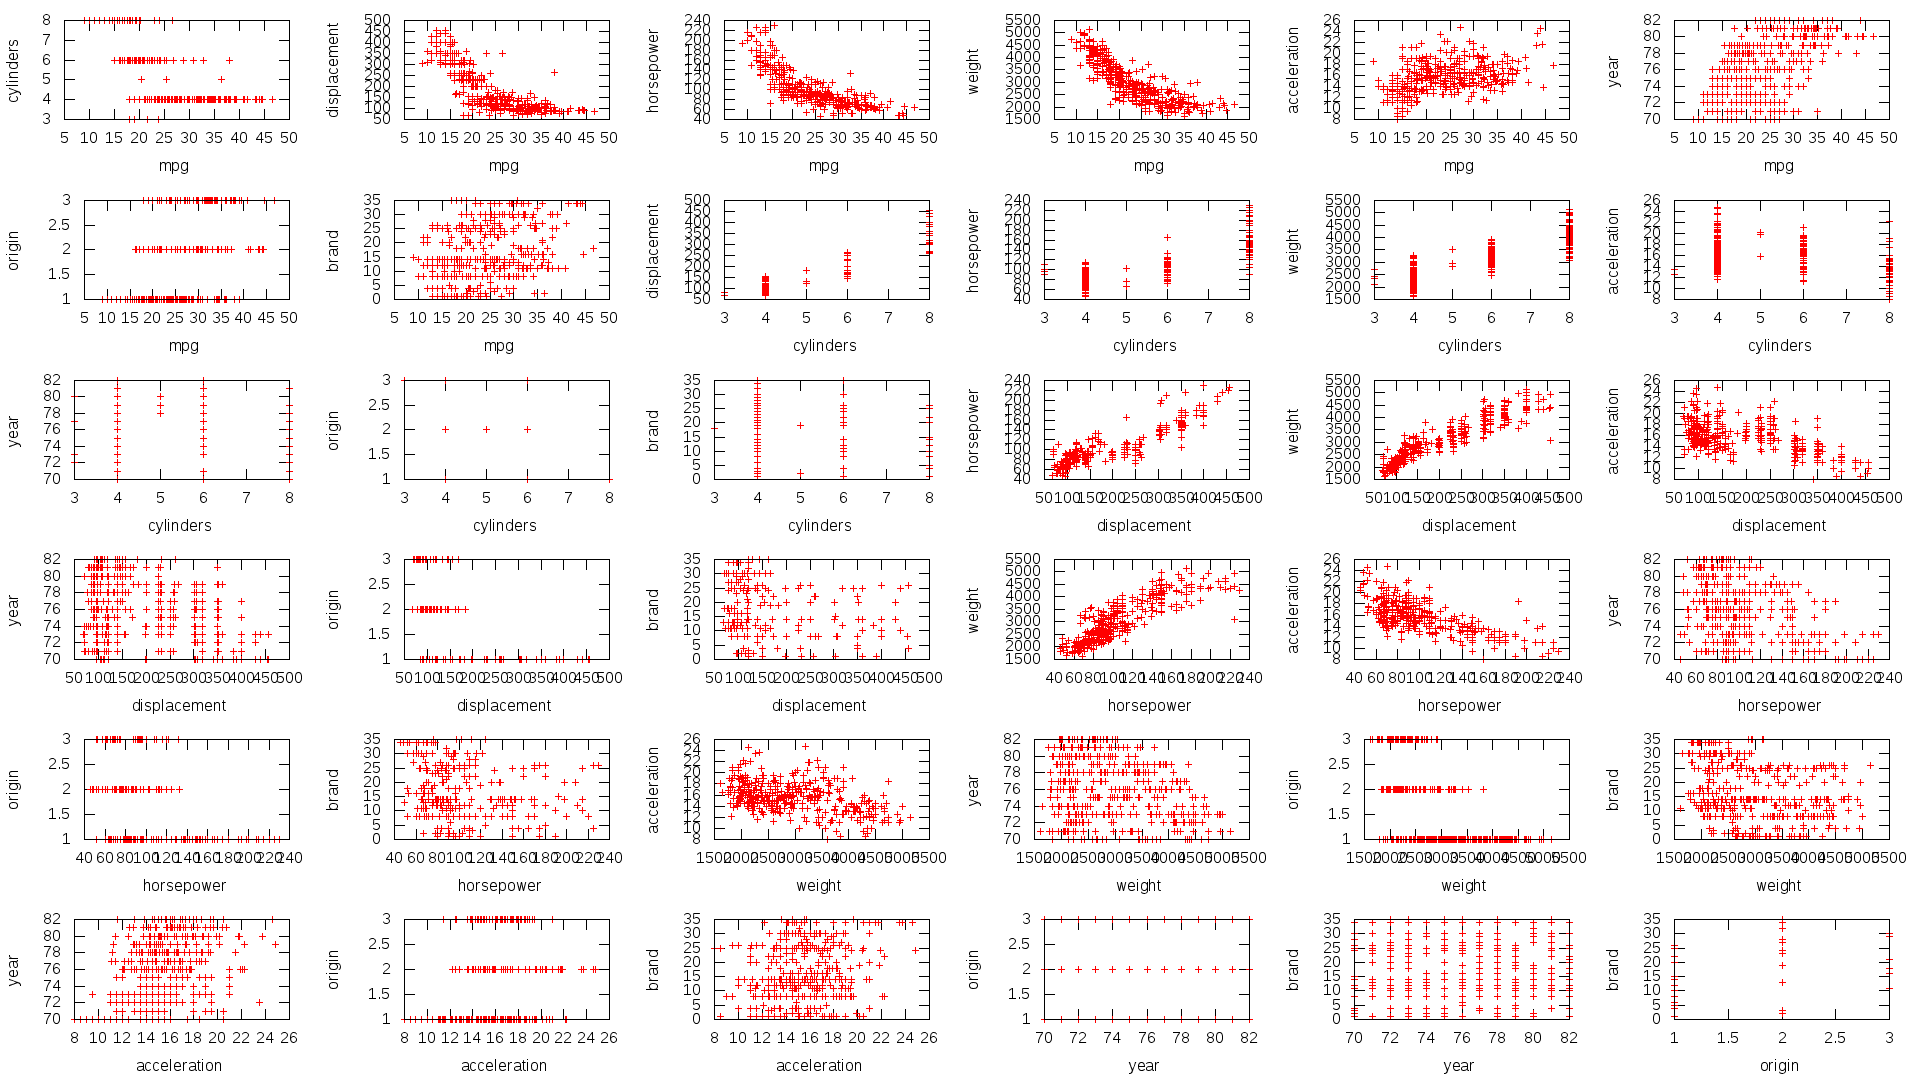
By visually comparing features with mpg we can see that:
- Bigger engines burn more fuel.
- Heavier cars burn more fuel.
- Newer cars have slightly better MPG.
- Each brand has a band of MPGs.
Feature selection
Some of these features appear to be highly correlated, so are effectively giving the same information more than once. By cutting out the less useful version, I keep my model as simple as possible which could help to avoid over fitting.
As we can see, horsepower has a nearly linear correlation with displacement. Which makes sense, bigger engine = more horse power. Also we see that more displacement and more cylinders make more horse power. Because of this, I am cutting it out. This also avoids the issue of some missing values for horsepower in the dataset.
Acceleration is closely related to weight and engine size, on top of this it does not have a clear correlation with MPG. Hes out too.
Also I am removing origin, as each brand has a country of origin, as well as a target demographic and more. This makes a brand a more descriptive feature.
To be able to use brand as a feature I add a column per brand. This has to be done in place of brand id because a higher id number does not relate to a brand being better or worse… it was just later in my list. So by having a class column per brand will allow my program to learn each brands relation to MPG properly.
This leaves me with the following features in my dataset:
- MPG
- cylinders
- air displacement
- weight
- year
- 36 brands
The last pre-processing step is to split my data up. 60% goes in the training set for linear regression to be trained on, 20% goes in the cross validation for tuning algorithm parameters, and 20% for the test set to see how well my algorithm works on previously unseen data.
My full pre-processing script is in prep_data.sh.
Linear regression for MPG
Now that I have my data prepared, I can actually work on some predictions!!
From here on it will be python time. Purely because I’ve always done this before in MATLAB / OCTAVE. It will be interesting to look at other ways of doing this.
First off I implemented un-regularised linear regression. This showed that this will work, and gave me a benchmark to improve on.
This involved normalisation and scaling of continuous features (whats the point in normalising binary columns?!), and adding a y intercept column. Next running gradient descent for 100,000 iterations (why not? Its a small dataset). This gave the following results:
Mean squared error on testset: 4.82.

So, now that I have a benchmark to work with I will try to decrease my generalisation error by adding regularisation and generating polynomial features.
I generated polynomials base on continuous fields only, as my binary brand columns would
just add noise when run through this process (BMW * weight)^2 makes no sense,
and the same value would already be generated as a result of weight^2.
I will find the optimal degree of polynomial, and value of my regularisation parameter by running gradient descent for 10,000 iterations for each combination of a range of values for each. The combination with the lowest error on my cross validation set is the one which I will keep and train over many more iterations.
Polynomials are generated in linear_regression.py using the method
generate polynomials.
Because of the shape of the plots showing the relation between displacement, horsepower and weight with MPG I expect the optimal degree of polynomial to be cubic, with some regularisation which will prevent my model from over fitting the training set.
I was a little surprised to find that the optimal degree of polynomial was 1, with no regularisation. I save the resulting values of theta, lambda, and p in a file ready to make real predictions. This is all happens in train_mpg.py

I then used these parameters to make predictions on my testset. Interestingly, while most predictions are improved, some get slightly worse. But the mean squared error on my test set is now reduced to 3.70. Success!

If you would like to see car names with these numbers, run predict_mpg.py. It outputs name, predicted mpg, actual mpg, and absolute error per car as csv.
How could this be improved?
Collecting more features on each car and having more examples in the dataset would most likely help in improving accuracy. Type of car (sports, SUV etc), type of transmission (manual / auto) and also fuel type (Diesel / petrol). Would be helpful in predicting MPG.
I was also surprised to see that regularisation didn’t help in this case. I think that this is due to having such a small dataset with so few features. Next time that I am in this situation I could try k-fold cross validation in order to make the most of the few training examples that I have.
I could also try a more intelligent means of feature selection, like using Pearson correlation to determine weather features are highly correlated or not before removing any, instead of manual selection. This would most likely prove to be more effective, and would be more justifiable even if it gave the same result.
And of course, I could have used an already existing linear regression library. This would most probably run faster, and be more accurate. But the point here was to learn.
Conclusion
I successfully implemented multivariate linear regression, and then I made it work better. In doing so I improved my understanding of linear regression and gradient descent, gained experience with numpy, practiced with gnuplot and bash scripting. This is exactly what I hoped to achieve. I hope that this will help someone else to gain a better understanding of this too.
Also almost all of my predictions were < 5mpg out. Given the small dataset with few features this is very pleasing to me.
When trying out my solution on many mixes of the dataset (re-run prep_data.sh and found that my work extracting brands pays off on some combinations of the dataset, but not others. Also depending on this my test cost can vary significantly. This makes sense I suppose as some brands have very few cars, and with only 60 examples in my test and cross validation sets, this could easily make a big difference. However if I had more car examples for all brands, with more features, then I am sure that this would prove to be useful every time.
For anyone who is interested, my finished code is here: https://github.com/nathamanath/auto_mpg_linear_regression
If you are playing along at home, you will need python 2.7, matplotlib, numpy and gnuplot. I ran all of this on Ubuntu 16.4
References
TLDR:
Implementing linear regression and gradient descent in python to predict MPG of cars in auto_mpg dataset.
Let's Make Your Next Project a Success!
Ready to take your digital presence to the next level? From design and development to ongoing support and maintenance, I provide the expertise to bring your vision to life.
Related technologies: